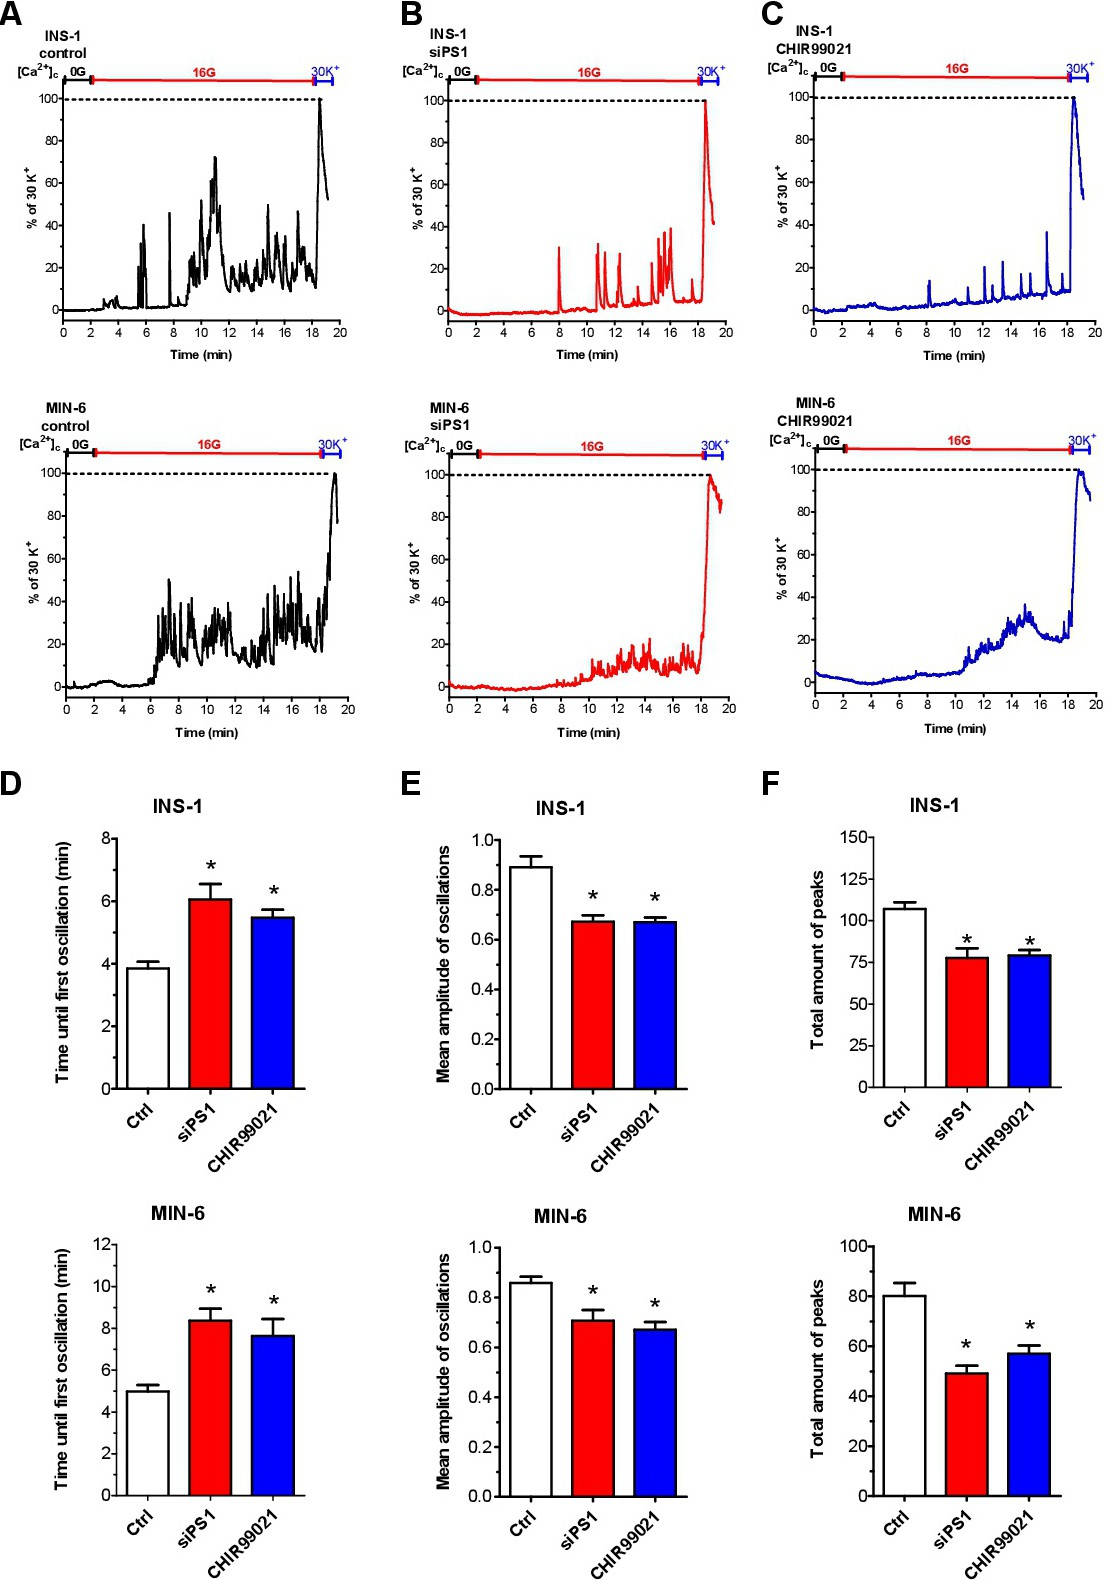
Fig. 3. ER Ca2+ leak is essential for the responsiveness of β-cells. (A-C) Representative traces showing glucose-induced cytosolic Ca2+ oscillations in INS-1 cells (upper panels) and in MIN-6 cells (lower panels) under control conditions (A), after knock-down of presenilin-1 with specific siRNAs (B) or after treatment with GSK3β inhibitor CHIR99021 (2.5 µM) (C). Cells were loaded with Fura-2/AM in experimental buffer (EB) for 40 min, followed by a 20 min incubation in glucose-free buffer (0G) before imaging. As bars indicate, cells were perfused with EB without glucose (0G) for 2 min prior switching to 16 mM glucose-containing EB (16G) during acquisition, followed by depolarization with 30 mM K+ to evaluate the maximum Ca2+ signal. Corresponding statistical analyses showing (D) time until first oscillation, (E) mean amplitude of the oscillations and (F) total amount of peaks under control conditions (white bars), after knock-down of presenilin-1 (red bars) or after treatment with GSK3β inhibitor CHIR99021 (2.5 µM) (blue bars). *p<0.05 versus control using one-way ANOVA (n≥126/6).